Climate Change & Health Equity
Certain factors put some people at a bigger risk for the health problems from climate change than others. This might be because of poverty, not having a car, living in a place where it floods a lot, or for other reasons. Explore this section to learn about what puts some people at a bigger risk than others and where the risks are the greatest in Illinois.
People at Risk Heading link
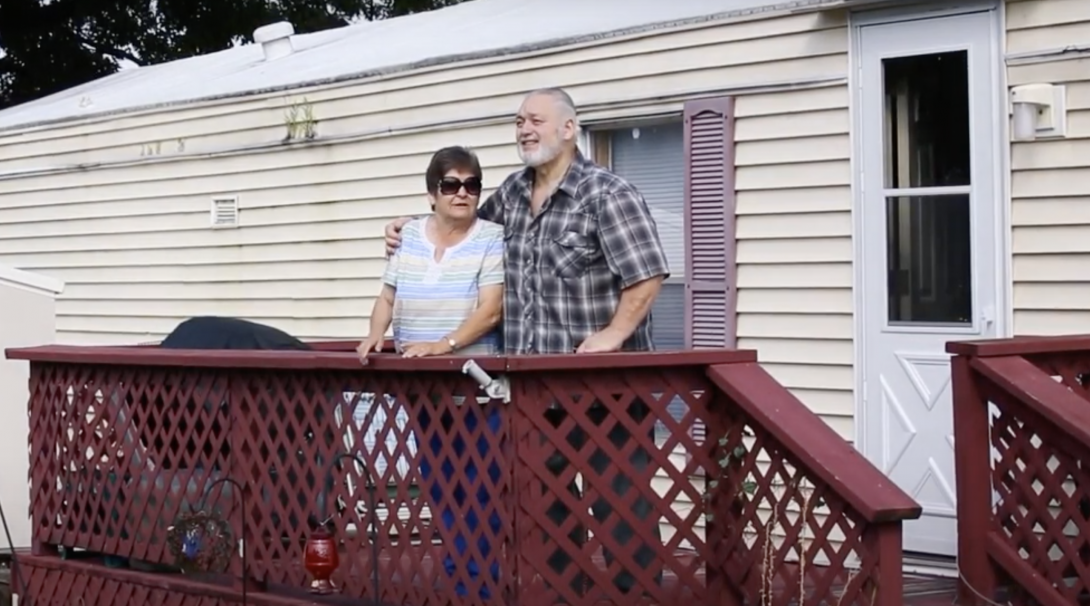
The home of Pam and Tony Monske, of Minooka, IL, was damaged during the 2013 spring floods. Their deductible doubled, they were still making repairs two years after the event, and they lost a number of valuable family items.
People at Risk (2) Heading link
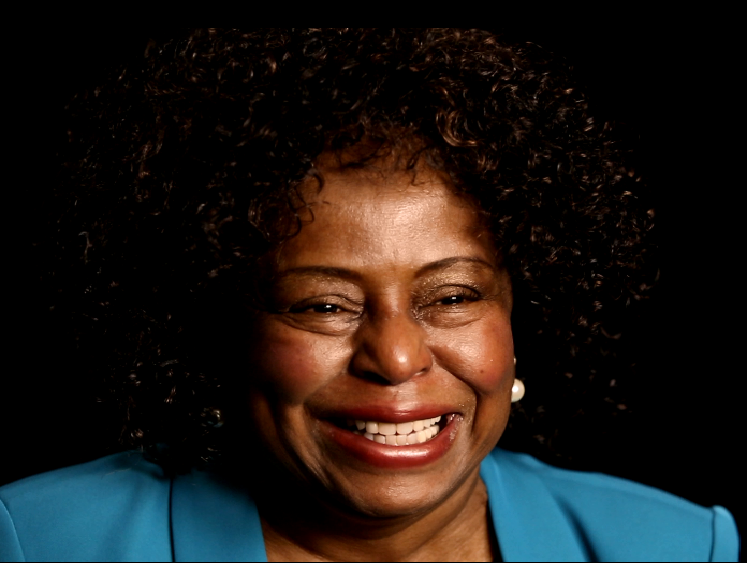
Dorothy Williams, a resident of South Holland, IL, suffers from the chronic respiratory disease sarcoidosis, which is an inflammatory disease that attacked her lungs. This disease makes it hard for her to breathe when the air quality is bad.
Health Equity Heading link
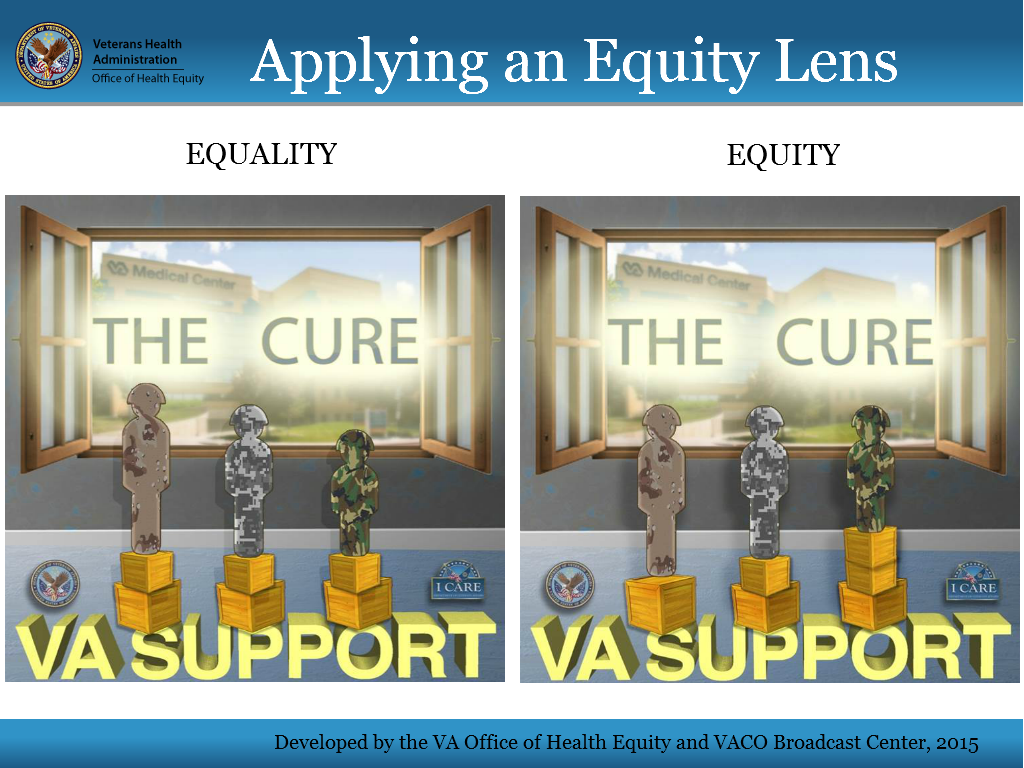
The image above shows the difference between equality and equity. The panel on the left shows each Veteran/Service Member standing on two bins. The Veteran/Service Member to the left, the tallest one of the three, has a clear view out of the window and can see the cure while the Veteran/Service Member to the far right, the shortest of the three, has an obstructed view of the cure. The Veteran/Service Member is barely able to see out the window or believe that relief is possible. This is an example of equality. All Veterans/Service Members receive the same number of bins or types of treatment, support, resources, etc.
Now look at the panel on the right. The number of bins differ for each Veteran/Service Member. Each Veteran/Service Member is given the needed number of bins to stand on in order to have an unobstructed view out of the window. Each can see the same opportunity for optimal health. The Veteran/Service Member on the left has been given one bin, the Veteran/Service Member in the middle has been given two bins, and the Veteran/Service Member on the right has been given three bins. This is fair and this is an example of equity. Each Veteran/Service Member gets enough boxes in order to ensure everyone has the same opportunity.
Health equity is when everyone has the opportunity to be as healthy as possible and this requires removing any obstacle or provide support to achieve that. Any sort of problem can prevent someone from being healthy and not everyone experiences the same problems. There a lot of existing problems like poverty, environmental degradation, weak storm water management systems, and health illnesses. Climate change will make existing problems worse. Climate change will make floods, heatwaves, wildfires, and poor air quality to be worse and happen more often. These natural disasters make existing problems worse and make the health problems worse. For example, low-income communities and communities of color often have more impermeable pavement, less green space and trees and there is more truck traffic and industry pollution. All of these can lead to a higher risk of flooding, higher temperatures, and worse air quality. This means that these people are at a higher risk for breathing problems, heat stroke, and property damage because of where they live. It is important to make sure people and communities that experience more problems receive more support.
Social Vulnerability Index Heading link
After floods, tornadoes, hurricanes, and other natural disasters strike, some communities are resilient and can ‘bounce back’ quickly, but in other communities, it can take a lot longer. Researchers at the CDC have found that four main features of communities are useful in predicting whether communities will be able to bounce back quickly. These are socio economic status, household composition, race/ethnicity/language, and housing/transportation. Communities that are vulnerable – those that may be hard-hit and take a long time recover after a natural disaster – have:
- Many people who live in poverty and are unemployed.
- Many people who have not completed high school.
- A lot of families with small children, a lot of senior citizens, or a lot of people with disabilities
- A lot of people who don’t speak English well.
- A lot of people who live in crowded conditions or in RV parks.
- A large number of families who don’t have a car.
The CDC combines these and other factors about communities into a “Social Vulnerability Index” or “SVI.” We used the SVI to identify communities in Illinois that may have a hard time managing the health problems that might happen due to extreme weather and climate change. This information can help the Illinois Department of Public Health plan and assist communities. Click here to take a closer look at your county. More information about the SVI is available at: CDC.gov
Social Vulnerability Index IMAGE Heading link

Overall Social Vulnerability Index (SVI) Illinois Map
Vulnerability to Flooding Heading link
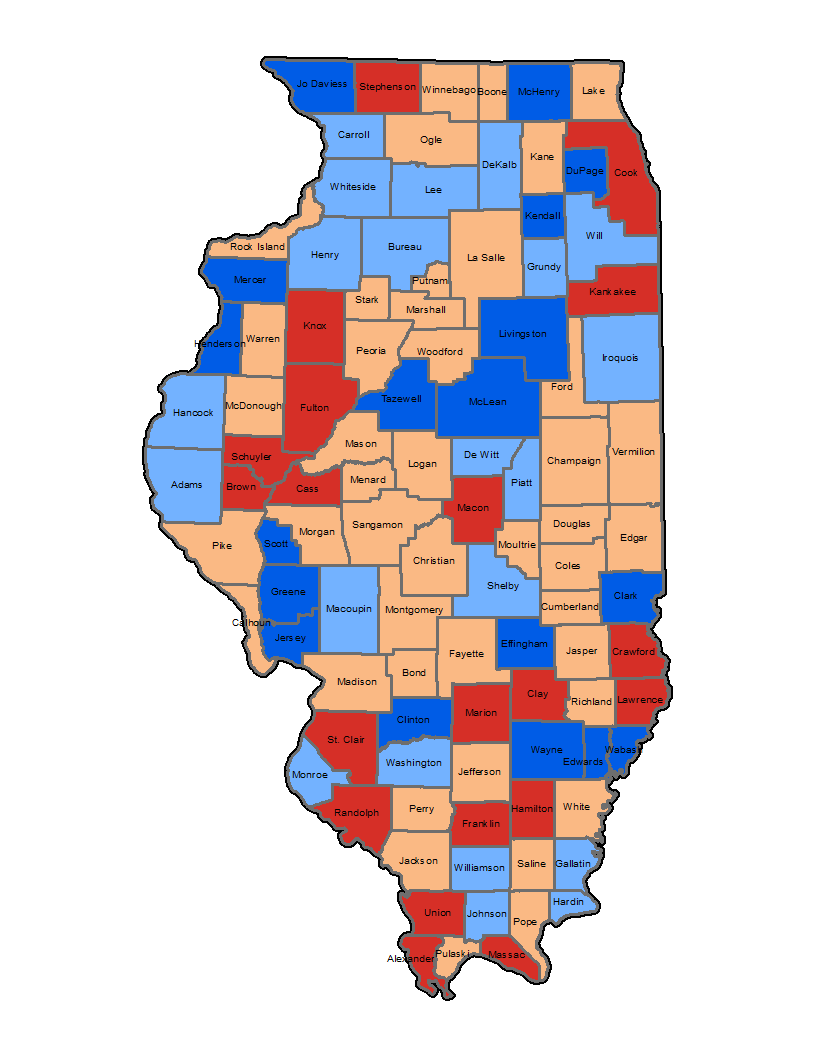
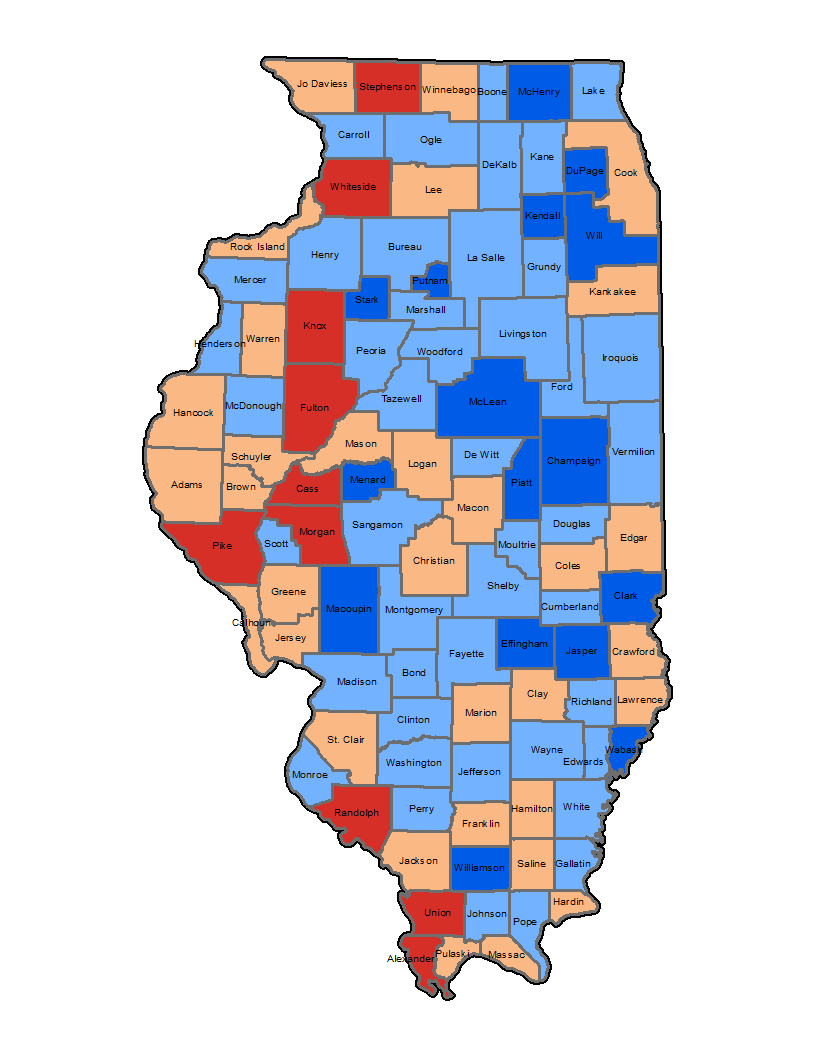
This map shows which counties in Illinois are at risk for health problems during a flood. The map was created by looking at each county’s vulnerability in three ways. First, we looked at how many federal disaster declarations for flooding there were in each county between 1981-2013. Second, we looked at how many nursing homes there are for each 10,000 people in the county. The reason we looked at nursing homes was because a lot of the people who died from Hurricane Katrina were residents of nursing homes. Nursing home residents were so vulnerable during Hurricane Katrina because many are older adults who might have chronic health problems, disabilities, or conditions that require extra help to leave an unsafe area. Third, we looked at counties that are most vulnerable according to the SVI.
By putting together information about each of these three pieces of information for each county, we were able to say whether counties were at greatest risk, somewhat lower risk, lower risk, or lowest risk. The counties in Illinois that are dark red are most at risk to health problems in nursing homes from flooding and the counties in dark blue are least at risk to flooding events.
Vulnerability to Ozone Pollution on Asthma Heading link
Ozone pollution is an air pollutant that is made through a combination of sunlight, heat, and air pollution that comes out of the exhaust pipes of cars and from factories. It is especially bad in the summer when temperatures are high. As the climate of Illinois gets warmer, we expect ozone levels to go up. Ozone can trigger asthma attacks, which can lead to the need for emergency treatment at a hospital or emergency room. In severe cases, it can cause death. This map shows which counties are at risk to asthma problems as the climate warms. Like the flood map, it takes into account three kinds of information. First, we looked at which counties in Illinois currently have high ozone levels (“EPA non-attainment” counties). Second, we looked at which counties have highest rates of death due to asthma. Third, we looked at which counties are most vulnerable based on the SVI. By using all three of these pieces of information, we found different levels of risk among counties. The counties in Illinois that are dark red are most at risk to health problems from poor air quality and the counties in dark blue are least at risk to health problems from poor air quality.