Effects
There are number of ways climate change is impacting our weather and agriculture in Illinois.
Agriculture Changes Heading link
The map on your left shows the observed changes in the growing season in Illinois based on an index temperature of 28 degrees Fahrenheit. The growing season is the number of consecutive days where the temperature has not gone below an index temperature for specific vegetation. An index temperature marks the beginning of a specific event such as 28 degrees Fahrenheit, which marks a freeze that can damage plants. If vegetation is more resistant to cold temperatures the index temperature would be lower. The map shows that the growing season for plants that can tolerate temperatures greater than or equal to 28 degrees Fahrenheit has become longer everywhere in Illinois with the largest growth being close to 15 days. The map on the right shows observed changes in the growing season in Illinois based on an index temperature of 32 degrees Fahrenheit and it has also become longer everywhere in Illinois with the largest growth being over 11 days.
Annual growing season 28°F Illinois
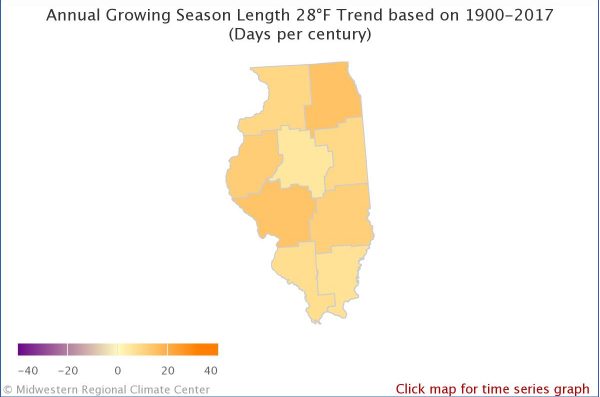
Annual growing season 28°F Illinois
Citation (Both Images): Midwestern Regional Climate Center https://mrcc.illinois.edu
Annual growing season 32°F Illinois
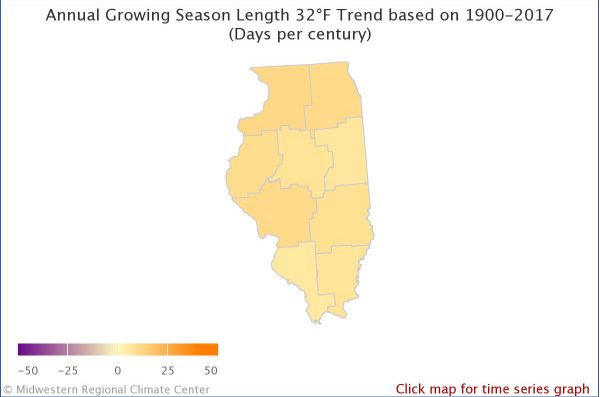
Annual growing season 32°F Illinois
Agriculture Changes Heading link
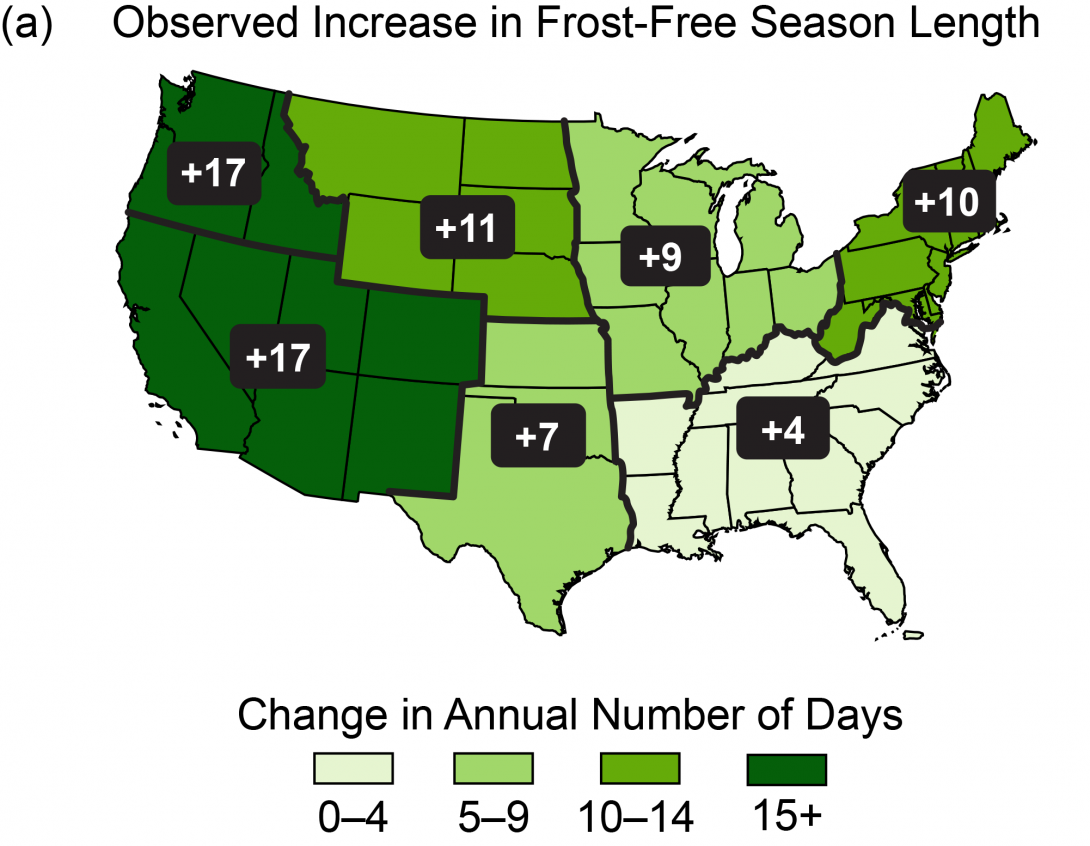
The map above shows the observed changes in the length of the frost-free season by region in the United States from 1901-2015. A frost-free season is defined as the number of days between the last spring occurrence and the first fall occurrence of a minimum temperature at or below 32°F. Frost-free season is nine days longer in the Midwest. Citation: Climate Change Special Report
Temperature Changes Heading link
The map on your left shows the observed changes in annual temperature in Illinois from 1895-2017. The average has increased everywhere. The map on your right shows the observed changes in annual temperature during the winter in Illinois from 1895-2017. Winter temperatures have increased everywhere in Illinois and temperatures have increased more in the winter than the average over the year.
Annual Average Temperature
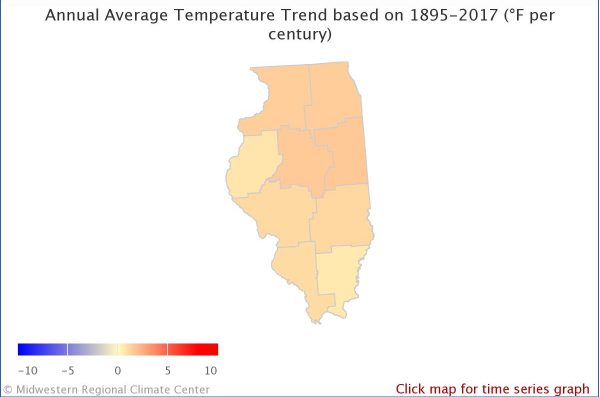
Citation(Both Images): Midwestern Regional Climate Center Midwestern Regional Climate Center
Winter Average Temperature
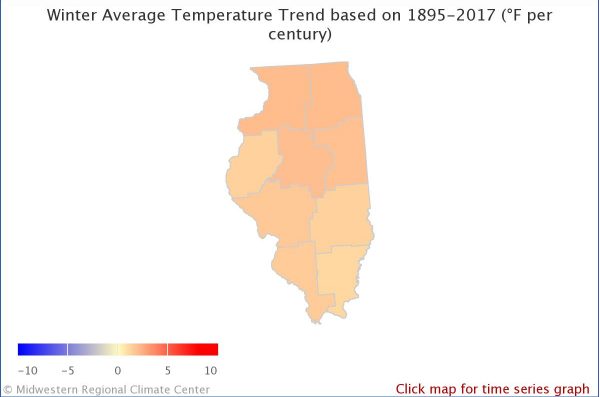
Winter Average Temperature
Temperature Changes Heading link
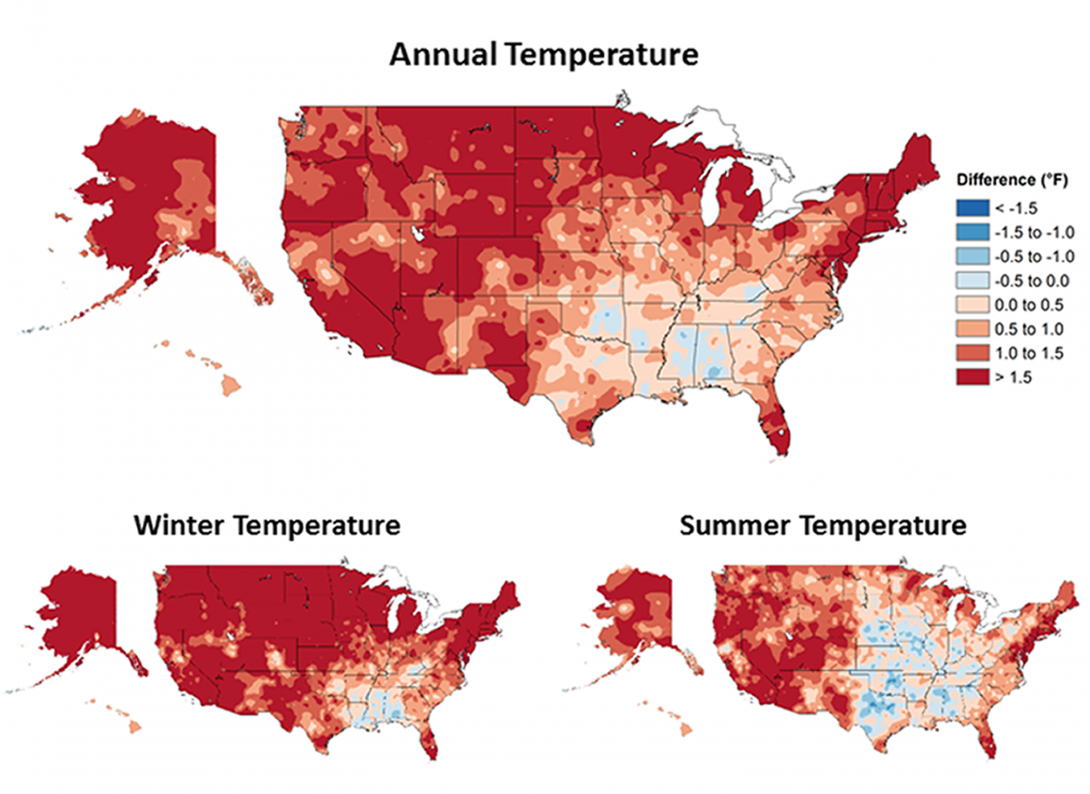
The large map of the United States shows the observed changes in annual temperature from 1901-2016. The two small maps show the average annual temperature change in the winter and summer. Temperatures are rising in much of the country and winters are much warmer. Citation: Midwestern Regional Climate Center
Precipitation Changes Heading link
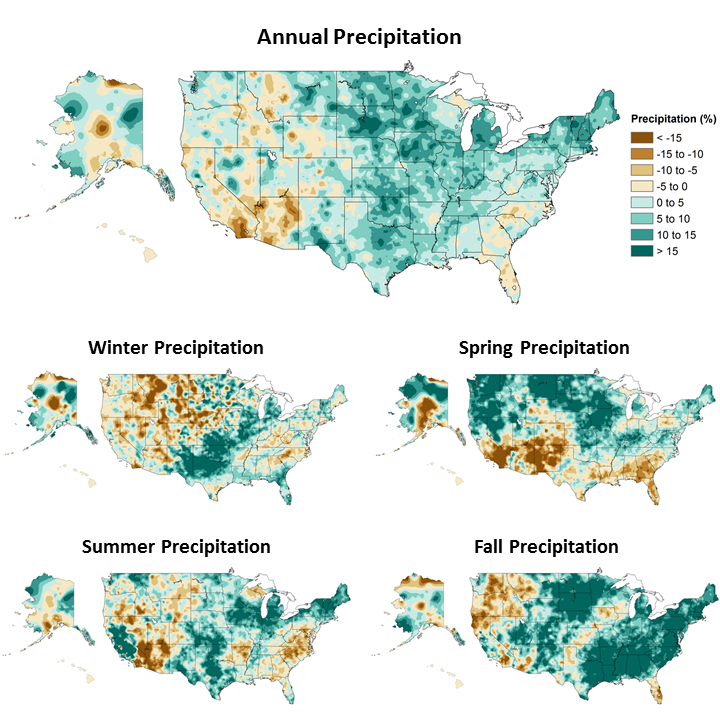
The large map of the United States show the annual changes in precipitation from 1901-2015. The smaller maps show the changes in precipitation in winter, spring, summer, and fall. The northeast, Midwest, and plains are all seeing more precipitation. Much of Illinois is seeing more precipitation during all seasons. Citation: Climate Science Special Report
Extreme Precipitation Events Heading link
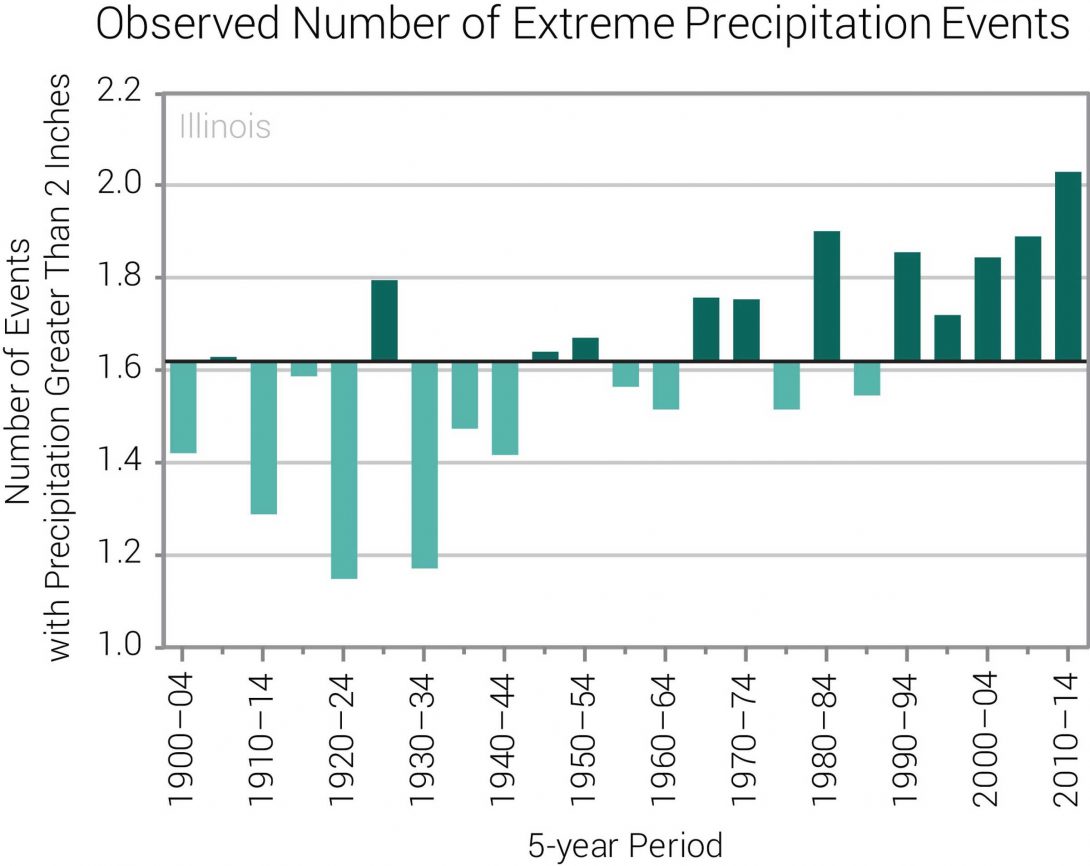
This graph shows the number of days with extreme precipitation events from 1900-2014, averaged over 5-year periods. An extreme precipitation event is when more than 2 inches of precipitation falls in one event. The number of extreme precipitation events has been above average since the 1990s. During the most recent 5-year period (2010–2014), Illinois experienced a record high number of events. Citation: NOAA National Centers for Environmental Information